
Resources
Resource refers to all the materials available in our environment which help us to satisfy our needs and wants. Resource Broadly be defined as any object which has potential to develops and use. An item becomes a resource with time and developing technology. The benefits of resource utilization may include increased wealth, proper functioning of a system, or enhanced well-being. From a human perspective, a natural resource is anything obtained from the environment to satisfy human needs and wants. Like water, Energy, Human Resource, Waste and so on.
The judicious and effective use of energy to maximize profits, minimize costs and enhance competitive positions.
The objective of Energy Management is to achieve and maintain optimum energy procurement and utilization, throughout the organization, to minimize energy costs / waste without affecting production & quality and to minimize environmental effects.
Energy audit- need, Types of energy audit, Energy management (audit) approach-understanding energy costs, Bench marking, Energy performance, Matching energy use to requirement, Maximizing system efficiencies, Optimizing the input energy requirements, Fuel and energy substitution, Energy audit instruments.
Energy conservation is an objective to which all the citizens in the country has to contribute. Whether a household or a factory, a small shop or a Hospital, a farmer or office worker, every user and producer of energy can and must make this effort for his own benefit, as well as that of the nation.
At the same time, concerns over the negative environmental impacts of inefficient uses of energy are growing, both globally and regionally.
How to abate global warming, seen to be caused by the accumulation in the atmosphere of "greenhouse gases" arising from combustion of fossil fuels, is now the subject of international negotiations. Such concerns require greater national efforts and greater international cooperation to promote energy efficiency and energy conservation.
More efficient energy use can increase productivity and economic competitiveness as well as lower greenhouse gas emissions per unit of output.
We have done Energy audit at various Units of Rainbow hospitals like: Banjara Hills, Vikrampuri and Vijayawada.
The overall objective of the assignment is to quantify energy saving in existing system and achieve reduction in energy consumption pattern. Hence the detail objectives are:
- To carry out the energy consumption.
- To evaluate the performance of the equipment.
- To find out the energy saving opportunities.
- To quantify the total energy savings.
- To find out the ways to achieve energy efficiency.
- To minimize financial losses.
- To improve financial Benefit.
- Installations of VFD to OT AHUs.
- DG trails for 0.5 hr/day to be taken in peak hours with load.
- Replacement of tubes and CFLs with LED Lights.
- Voltage optimization for lighting load.
- Reduction in specific consumption for compressor by regular maintenance.
- Insulations to AC units and supply line to avoid AC wastages by that power conservation steps taken.
- Reducing virtual energy consumption kVAh by repairing/installing capacitors.
- Improving operation and maintenance of air conditioning units by regular filter cleaning.
- The outdoor units have been doing service once in 15 days to keep them clean & maintain the heat exchange surfaces effective.
- Compressors have been maintained such that the suction pressure is maintained at 70-75 psi.
- Evaporative pre-cooling of air around the outdoor units.
- Solar Power pack installation initiative has been taken at new Banjara unit in part of energy management.
The Energy Performance Index (EPI) of the hospital is the indicator of the energy performance of the hospital and represents the total specific use of energy consumed in hospital building. It is presented in kWh/ (Sq.m in year).
NATIONAL EPI-BENCHMARK FOR HOSPITALS (BEE STANDARDS)
Air conditioned- EPI: 84 - 865
For compositional climate zone EPI: 200 – 400 (Air conditioned)
- NATIONAL EPI-BENCHMARK FOR HOSPITALS (Bureau of Energy Efficiency Standards)
- Air conditioned- EPI: 84 - 865
- For compositional climate zone EPI: 200 – 400 (Air conditioned)
- Warm & Humid 275
- Composite 264
- Hot & Dry - 261
- Moderate - 247
b. LB Nagar
i. we saved around 70794 units/year and 5800 units/month
ii. Financially we saved around 70000 per year
iii. Reducing 64 Tons of CO2 production
c. Rosewalk
i. we saved around 303182 units/year and 25265 units/month
ii. Financially we saved around 3031820 per year
iii. Reducing 276 Tons of CO2 production
d. Vizag
i. we saved around 70794 units/year and 5800 units/month
ii. Financially we saved around 6104740 per year
iii. Reducing 555 Tons of CO2 production
- Solar Power Generation Capacity is being enhanced.
- AC temperatures fixed at 23 degrees for nonclinical Areas
- Usage of Energy efficient equipment at all levels
- Optimal utilization of solar energy for light and Water heating (installed solar Energy on the rooftop of 6 of our units)
- LED Lights are being installed in Existing projects and New Projects as well to reduce Electrical Power consumption, Efficient Chillers, DG sets, and Pumps have been installed for New Projects.
- Building Management System (BMS) in place for efficient HVAC operations.
- Variable Frequency Drives have been installed to conserve energy across Hospitals.
- As part of the design standard, for all new upcoming projects, existing, standardized hot water generation systems with solar panels and heat pumps are being followed.
- Rainbow Hospitals continues to explore avenues to employ a renewable source of energy like solar power.
Capital Investment we have done in two areas for FY 2021-22
a. Hydernagar – Solar heating system & LED lights fixtures – 2, 92,000/-
b. Delhi Malviyanagar – Motion sensor & LED light fixtures – 7, 00,110/-
c. Rose walk – LED lights – 1, 10,000/-
d. Marathahalli – Motion sensor – 40,000/-
e. BG Road – LED light Fixtures – 2,72,500/-
At Sholinganallur, Chennai for Motion sensors, VFDs and Heat Pumps we have spent – Rs 1706757/-
At Financial District of Hyderabad for Motion sensors and VFDs we have spent – Rs 1206375/-
At Marthahalli 5th floor, Bangalore for Motion sensors and VFDs we have spent around Rs 800000/-
- We saved around 57672 units/year and 4806 units/month i.e. 6.5% of energy consumption.
- Financially we saved around Rs 5,76,000, per year
- Reducing 52 Tons of Co2 production.
- We saved around 47594 units/year and 3966 units/month i.e. 3% of energy consumption.
- Financially we befitted around RS. 4,75,000 per year
- Reducing 42 Tons of Co2 production.
- We saved around 116012 units/year and 9667 units/month i.e. 3.5% of energy consumption.
- Financially we befitted around RS. 11,60,000 per year
- Reducing 104 Tons of Co2 production.
1. Capital Expenditure - investments in specific technologies to improve the environmental and social impacts of product: Investment or Capital expenditure done technologies to improve Environment/ impact
We have done investment at two areas one is on new projects and other one is on running units.
- On projects we have spent Rs 17688934 on Solar roofing, Solar water heaters, Sewage treatment plant, LED lighting system and Energy efficient Heat pumps.
- On running units, we have spent for Energy efficient Heat pumps at Kondapur, LED lights at Marathahalli, Solar roof top at Rosewalkunit , fixing of Aerators at Vijayawada and Hebbal, all together we have spent Rs 2100000/-
Impact of Products: Operational cost reduction, resource optimization, improvement of Energy efficiencies,Energy sources sustainability, Carbon emission reductionsandimproving the life span of Assets etc.
As per previous year Energy consumption levels (Per day/bed) we supposed to be utilized 22230706 Units but we have utilized 18789729 Units, it means that indirectly we saved 3440977 Units in reporting period.
With this we have benefited in two ways – both economically and environmentally, Environmentally we have indirectly reduced Carbon emissions
- Installation of Motion sensors
- Switching off ACs at unutilized areas
- Keeping little high temperatures at restricted areas in un-utilizing times
- Voltage optimization for lighting load.
- Reduction in specific consumption for compressor by regular maintenance.
- Insulations to AC units and supply line to avoid AC wastages by that power conservation steps taken.
- Reducing virtual energy consumption kVAh by repairing/installing capacitors.
- Improving operation and maintenance of air conditioning units by regular filter cleaning.
- The outdoor units have been doing service once in 15 days to keep them clean & maintain the heat exchange surfaces effective.
- Evaporative pre-cooling of air around the outdoor units.
- Solar Power pack installation initiative has been taken at new Banjara unit in part of energy management.
- We saved around 398749 units/year and 33229 units/month i.e. 10 % of energy consumption.
- Financially we saved around Rs 3980000, per year
- Reducing 362 Tons of Co2 production.
- We saved around 605848 units/year and 50487 units/month i.e. 32 % of energy consumption.
- Financially we saved around Rs 6050000 per year
- Reducing 551 Tons of Co2 production.
- We saved around 248645 units/year and 20720 units/month i.e. 25 %of energy consumption.
- Financially we saved around Rs 2480000 per year
- Reducing 226 Tons of Co2 production.
- We saved around 89050 units/year and 7421 units/month i.e. 5%of energy consumption.
- Financially we saved around Rs 890000 per year
- Reducing 81 Tons of Co2 production.
- We saved around 440318 units/year and 36693 units/month i.e. 24 %of energy consumption.
- Financially we saved around Rs 4400000 per year
- Reducing 400 Tons of Co2 production.
- We saved around 233069 units/year and 19422 units/month i.e. 25 %of energy consumption.
- Financially we saved around Rs 2330000 per year
- Reducing 212 Tons of Co2 production.
- We saved around 240871 units/year and 20072 units/month i.e. 39 %of energy consumption.
- Financially we saved around Rs 2400000 per year
- Reducing 219 Tons of Co2 production.
- We saved around 87788 units/year and 7316 units/month i.e.10 %of energy consumption.
- Financially we saved around Rs 870000per year
- Reducing 80Tons of Co2 production.
- We saved around 575163 units/year and 47930 units/month i.e. 62 %of energy consumption.
- Financially we saved around Rs 5750000 per year
- Reducing 523 Tons of Co2 production.
- We saved around 35695 units/year and 2974 units/month i.e.5 %of energy consumption.
- Financially we saved around Rs 350000 per year
- Reducing 32 Tons of Co2 production.
- We saved around 407398 units/year and 33950 units/month i.e. 36 %of energy consumption.
- Financially we saved around Rs 4070000 per year
- Reducing 370 Tons of Co2 production.
- We saved around 78383 units/year and 6532 units/month i.e. 15 %of energy consumption.
- Financially we saved around Rs780000 per year
- Reducing 71Tons of Co2 production
Water management is the management of water resources under set policies and regulations. Water, once an abundant natural resource, is becoming a more valuable commodity due to droughts and overuse. Water management subject - such as the optimization of water usage.
It is to understand existing demand, usage and identify interventions to reduce water use and operational costs.
The Scope of Water Audit inter/alia would include the following:
- Reviewing data to analyze historic water use.
- Collecting data to analyze current water use.
- Studying the operational characteristics of the hospitals and associated facilities.
- Quantifying water and cost savings for each identified potential intervention.
- Provision of recommendations and justification for further detailed water usage and its conservation.
ith above practices, even though load has increased to 20% higher than previous year consumption level it remains same.
- Calculative Values of 45 lts/day/person
For the above mentioned units, in total 2,10,92,701 liters of water consumption has been reduced by water conservation measures
At few of Rainbow units have done water conservations when compare with previous year, we have saved water by practicing operational excellence
- By fixing of Aerators we have controlled water wastage
- At most of the Green filed units we are recycling water
- Fixing of leakages
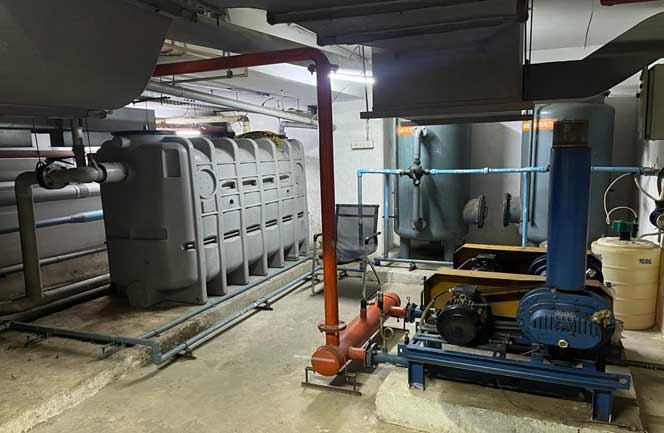
As per hospital policy we are treating waste water through STP and ETP with two objectives, one is for Water conservation and other objective is for decontamination of infected water to safeguard the Environment and near communities. After treating and processing through UV filtration Recycling for non-contact usage. Using for flushing, gardening and parking area cleaning.
At most of the units we are using SBR technology STP treatment plant with different capacities on basis of Hospital size &load, Treated wateris recycled ( using back),which are around 60 % of treated water for non-contacting areas.
The waste(or) Scrap like items is discarded after use are packed materials left over from product manufacturing and consumption
Dry waste [Black bin] Dry waste comprises of things like paper, glass, plastic, newspapers cardboard, bottles,food packaging material etc...
Wet waste[Green bin] is all the kitchen waste that we produce. This can include vegetable peels, used tea, fruits, leftovers.
Bio medical waste is disposing through Bio waste disposing vendors as per the PCB norms.All bio medical waste discarding as per SPCB and CPCB disposal norms of BMW act 2016 new rules.
- Yellow Anatomical waste, chemical waste, soiled waste, chemotherapy waste, discarded linen and medicines and laboratory waste
- Red Contaminated plastic waste Disposable items such as tubing, plastic bottles, intravenous tubes and catheters, cannulas, syringes without needles
- Blue Glass waste and metallic implants Glassware such as broken and discarded vials, bottles, slides, glass petri dishes etc.
- White Metal sharps Waste sharps such as needles and blades (in puncture proof container)
- Black Hazardous and Other waste Used containers of disinfectants and pesticide, used CFL bulb/tube light, lithium ion /alkaline batteries etc.
Rainbow hospitals has adopted e waste policy under provisions & guidelines ordered by MoEF - in exercise of the powers conferred by sections 6, 8 and 25 of the Environment (Protection) Act, 1986 (29 of 1986), and in supersession of the e waste (Management and Handling) Rules, 2011, published in the Gazette of India, section 3, sub-section (ii), vide number S.O. 1035(E), and PCB guidelines rainbow hospital will bind to implement the e waste rules as consumer of electronic goods.
E-waste has been defined as waste electrical and electronic equipment, whole or in part or rejects from their manufacturing and repair process, which are intended to be discarded . Whereas Electrical and electronic equipment has been defined as equipment which is dependent on electrical currents or electro-magnetic fields to be fully functional
Rainbow adopted SOP for disposing e waste with environmental safety is at highest: E-waste covers all electronic and electrical goods which are not working including batteries. These are disposing through Ramky enviro group who is the PCB authorized e waste recycler.
- Micro E-Waste
- Macro E-Waste
Small Batteries(pencil), & Smaller UPS Batteries, Printer Cartridge, T.V ,CD, DVD, Speaker, Electrical /Electronic devices, Data cable, Medical Equipment cables, CFL, Tubes ,LED lamps etc....
Defective Electrical/ Electronic Equipments, Medical Equipments Computer monitors, Printers, Scanners and Similar Items. In rainbow premises and at corporate building we kept Separate bins for collection of E waste, vendor will collect it on demand basis as per agreement. Yearly we are disposing approximately 1000kgs of E waste.
we are disposing to Authorized persons only ,like Alfa refineries at Bangalore to avoid land filling and other unauthenticated practices of waste disposal.
Scrap consists of recyclable materials left over from product manufacturing and consumption, such as parts of vehicles, building supplies, and surplus materials. Unlike waste, scrap has monetary value, especially recovered metals, and non-metallic materials are also recovered for recycling.
- Plastic Waste 1.3 Metric Tones
- E-waste 1.1 Metric Tones
- Bio-medical Waste 282.98 Metric Tones
- Construction and demolition waste 150 Metric Tons.
- Battery Waste 0.225 Metric Ton.
- Other Hazardous Waste 0.52 Metric Tons.
- Other Non-Hazardous Waste General Waste (Dry+ Wet) 636.657Metric Tones. - Total = 1072.782 Metric Tones.
Waste Generated for the period April 2023 to March 2024
a. Plastic Waste - 5.86 Metric Tons
b. E-Waste - 3.03 Metric Tons
c. Bio-medical waste - 325.72 Metric Tons
d. Construction & Demolition - 25.42 Metric Tons
e. Battery waste - 0.09 Metric Tons
f. Other Hazardous waste - 0.112 Metric Tons
g. Other Non - Hazardous waste (Dry + Wet + Carton Boxes + Iron + Paper) - 838.04 Metric Tons
h. Total - 1198.27 Metric Tons
Waste Generated for the period April 2024 to March 2025
a. Plastic Waste - 4.06 Metric Tons
b. E-Waste - 1.73 Metric Tons
c. Bio-medical waste - 339.17 Metric Tons
d. Construction & Demolition - 0 Metric Tons
e. Battery waste - 3.35 Metric Tons
f. Radioactive Waste - 0 Metric Tons
g. Other Hazardous waste - 0.35 Metric Tons
h. Other Non - Hazardous waste (Dry + Wet + Carton Boxes + Iron + Paper) - 935.12 Metric Tons
Total Waste - 1283.97 Metric Tons
Waste Generated for the period April 2025 to March 2026
a. Plastic Waste - 5.74 Metric Tons
b. E-Waste - 3.48 Metric Tons
c. Bio-medical waste - 365.68 Metric Tons
d. Construction & Demolition - 0.36 Metric Tons
e. Battery waste - 0.01 Metric Tons
f. Radioactive Waste - 0 Metric Tons
g. Other Hazardous waste - 0.97 Metric Tons
h. Other Non - Hazardous waste (Dry + Wet + Carton Boxes + Iron + Paper) - 1307.32 Metric Tons
Total Waste - 1683.56 Metric Tons
Solar Energy Details - 2021-22

Marathahalli - 80KWP (2021-22)
Solar energy production is 91324 units for reporting period, economically which is contributed around Rs 913240/- per year and ecologically we have avoided around 100 tons of Carbon Emissions.

Banjarahills - 200KWP (2021-22)
Solar energy production is 150645 units for reporting period, economically which is contributed around Rs 1506450/- per year and ecologically we have avoided around 166 tons of Carbon Emissions.

BG Road - 40KWP (2021-22)
Solar energy production is 48108 units economically contributed around Rs 481080/- per year and ecologically avoided around 52 tons of Carbon Emissions.

Delhi – 25KWP (2021-22)
Solar energy production is 16646 units economically which is contributed around Rs 166460/- and ecologically avoided around 18 tons of Carbon Emissions.

Kondapur – 50KWP (2021-22)
Solar energy production is 11520 units per year economically benefited around Rs 1,15200/- and ecologically avoided around 12 tons of Carbon Emissions.

Hebbal - 40KWP (2021-22)
Solar energy production is 24430 units per year economically benefited around Rs 2,44,300/- and ecologically avoided around 26 tons of Carbon Emissions.

Solar Water Heaters
Solar Energy Details - 2022-23
Across Rainbow we have Solar water heaters with average Capacity of 25 KW at each unit, with this we are saving 675000 units of energy in a year from Electricity board and getting benefitted in Monitory terms – worth of Rs 6000000- & Contributing to Carbon emission reduction over 573 Metric Ton of Co2 equivalent..
Solar Rooftops

Hydernagar - 33Kwp (2023-24):
Solar energy production is 6754 units per year, economically benefitted around Rs. 67540/- and ecologically avoided around 5.7 Tons of CO2 emission.

LB Nagar - 58 Kwp (2023-24):
Solar energy production is 720 units per year, economically benefitted around Rs. 7200/- and ecologically avoided around 0.6 Tons of CO2 emission.

Sholinganallur - 80 Kwp (2023-24):
Solar energy production is 43072 units per year, economically benefitted around Rs. 430720/- and ecologically avoided around 37 Tons of CO2 emission.

Rosewalk - 30 Kwp (2022-23):
Solar energy production is 21614 units per year, economically benefitted around Rs. 216140/- and ecologically avoided around 18.3 Tons of CO2 emission. Note: Rosewalk Solar panels were installed in March 2023 end so, in last FY it will be shown.
SOLAR ENERGY GENERATION DETAILS FOR 2023-24
Solar energy generation is 147843 units for reporting period, economically which is contributed around Rs 1478430/- per year and ecologically we have avoided around 125.6 Tons of Carbon Emissions
Solar energy generation is 87189 units for reporting period, economically which is contributed around Rs 871890/- per year and ecologically we have avoided around 74.1 Tons of Carbon Emissions
SSolar energy generation is 44150 units for reporting period, economically which is contributed around Rs 441500/- per year and ecologically we have avoided around 37.5 Tons of Carbon Emissions
Solar energy generation is 6754 units for reporting period, economically which is contributed around Rs 67540/- per year and ecologically we have avoided around 5.7 Tons of Carbon Emissions
Solar energy generation is 720 units for reporting period, economically which is contributed around Rs 7200/- per year and ecologically we have avoided around 0.6 Tons of Carbon Emissions
Solar energy generation is 16404 units for reporting period, economically which is contributed around Rs 164040/- per year and ecologically we have avoided around 13.9 Tons of Carbon Emissions
Solar energy generation is 21614 units for reporting period, economically which is contributed around Rs 216140/- per year and ecologically we have avoided around 18.3 Tons of Carbon Emissions
Solar energy generation is 26880 units for reporting period, economically which is contributed around Rs 268800/- per year and ecologically we have avoided around 23 Tons of Carbon Emissions
Solar energy generation is 43072 units for reporting period, economically which is contributed around Rs 430720/- per year and ecologically we have avoided around 37 Tons of Carbon Emissions
Solar energy generation is 35651 units for reporting period, economically which is contributed around Rs 356510/- per year and ecologically we have avoided around 30 Tons of Carbon Emissions
SOLAR ENERGY GENERATION DETAILS FOR 2022-23
Solar energy generation is 130985 units for reporting period, economically which is contributed around Rs 1309850/- per year and ecologically we have avoided around 119 tons of Carbon Emissions.
Solar energy generation is 83302 units for reporting period, economically which is contributed around Rs 833020/- per year and ecologically we have avoided around 76 tons of Carbon Emissions.
Solar energy generation is 30320 units for reporting period, economically which is contributed around Rs 303200/- per year and ecologically we have avoided around 27tons of Carbon Emissions.
Solar energy generation is 48581 units for reporting period, economically which is contributed around Rs 485810/- per year and ecologically we have avoided around 44tons of Carbon Emissions.
Solar energy generation is 8640 units for reporting period, economically which is contributed around Rs86400/- per year and ecologically we have avoided around 8tons of Carbon Emissions.
17063 units Solar energy Generated in reporting period, economically which is contributed around Rs 170630/- per year and ecologically we have avoided around 15 tons of Carbon Emissions.
Solar energy generation is 28111 units for reporting period, economically which is contributed around Rs 281110/- per year and ecologically we have avoided around 25tons of Carbon Emissions.

- Emergency Care
- General Pediatrician
- Neonatal Intensive Care Unit
- Pediatric Intensive Care Unit
- Pediatric Neurology
- Pediatric Hemato- Oncology
- Pediatric ENT
- Pediatric Urologist
- Pediatric Gastroenterologist
- Pediatric Cardiologist
- Pediatric Orthopedics
- Pediatric Ophthalmology
- Pediatric Dentistry
- Pediatric Physiotherapy
- Pediatric Endocrinology
- Women’s Nutrition
- Pregnancy & Delivery
- Painless Delivery & Labor
- In Vitro Fertilization (IVF)
- Infertility
- Best Pediatrician in Hyderabad
- Best Pediatrician in Bengaluru
- Best Pediatrician in Delhi
- Best Pediatrician in Chennai
- Best Pediatrician in Vijayawada
- Best Pediatrician in Vizag
- Best Gynecology and Obstetrician in Hyderabad
- Best Gynecology and Obstetrician in Bengaluru
- Best Gynecology and Obstetrician in Delhi
- Best Gynecology and Obstetrician in Chennai
- Best Gynecology and Obstetrician in Vijayawada
- Best Gynecology and Obstetrician in Vizag
- Best Fertility Specialist in Hyderabad
- Best Fertility Specialist in Bengaluru
- Best Fertility Specialist in Delhi
- Best Fertility Specialist in Chennai
- Best Fertility Specialist in Vijayawada
- Best Fertility Specialist in Vizag

Copyright © 2026. All Rights Reserved by Rainbow Children’s Medicare Ltd.


Copyright © 2026. All Rights Reserved by Rainbow Children’s Medicare Ltd.